

Conference room analytics: A guide to measuring and improving meeting space


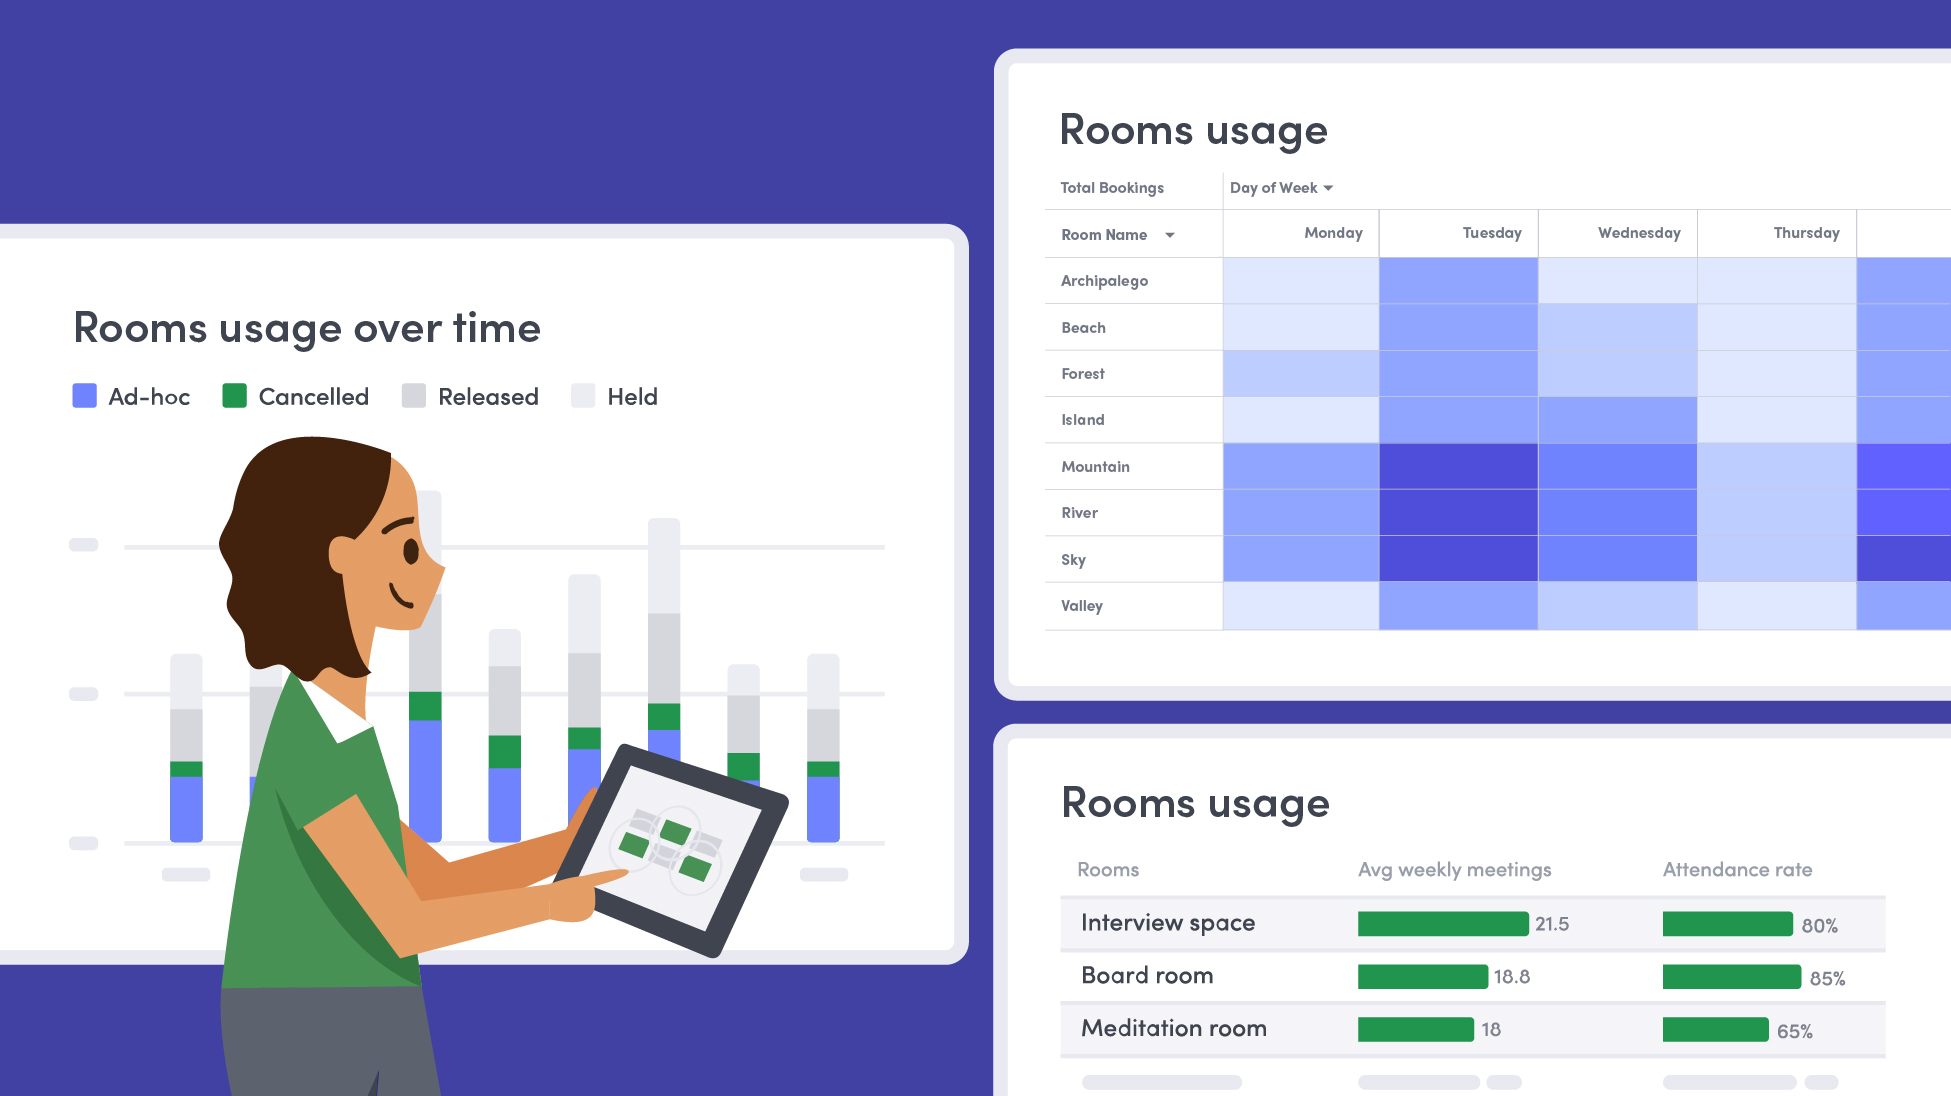
Your conference rooms can look booked solid while valuable space goes unused. No-shows, oversized room bookings, and recurring meetings can all make availability seem tighter than it really is.
This guide breaks down the conference room metrics worth tracking, how to calculate them, what the benchmarks say, and how to use the data to make better space decisions.
What are conference room analytics?
Conference room analytics is the process of collecting and analyzing data about how meeting rooms are booked and used.
Booking data tells you what employees intended to use. Check-ins and occupancy data can tell you whether the room was actually used, for how long, and by how many people. Looking at both helps workplace teams answer questions such as whether they have enough meeting rooms, whether rooms are the right size, and how often bookings prevent other employees from accessing space they could have used.
A conference room booking system can provide much of the booking data behind these insights. Depending on the level of accuracy you need, you can supplement it with check-ins, workplace presence data, or occupancy sensors.
The important part is knowing what each data source represents, because a booked room isn’t necessarily a used room.
6 conference room analytics metrics to track
Unfortunately, there isn’t one metric that tells you whether your meeting spaces are working well. The most useful picture comes from looking at several together.
1. Room utilization rate
Room utilization rate measures how much of a room’s available time is actually used.
Formula: Room utilization rate = (actual occupied room hours ÷ total available room hours) × 100
For example, if a conference room is available for 40 hours during the workweek and is actually occupied for 18 hours: 18 ÷ 40 × 100 = 45% utilization
Be precise about what you’re measuring. If you only have calendar data, calculate booked utilization instead: Booked utilization = (booked room hours ÷ available room hours) × 100
Remember: A room can have high booked utilization and much lower actual utilization if employees routinely cancel late or fail to show up.
2. Room occupancy rate
Utilization tells you how often a room is used. Occupancy tells you how efficiently its capacity is used when people are there.
One useful way to measure it is: Room occupancy rate = (average number of attendees ÷ room capacity) × 100
If three people use an eight-person room: 3 ÷ 8 × 100 = 37.5% occupancy
Track this by room size, not just across your entire office. Consistently low occupancy in larger rooms can mean your meeting-space mix doesn’t match how employees collaborate.
And room capacity isn’t the only factor driving demand. Gensler’s 2026 Global Workplace Survey found that a majority of workers use meeting rooms for focused work, showing how conference rooms can also fill gaps for privacy and individual work, not just group meetings.
3. No-show rate
A no-show happens when someone books a meeting room but the meeting never takes place.
Formula: No-show rate = (no-show bookings ÷ total room bookings) × 100
If 12 out of 100 room reservations go unused: 12 ÷ 100 × 100 = 12%
A high no-show rate creates artificial scarcity. Employees see a room as unavailable even though nobody is using it.
VergeSense’s fourth Occupancy Intelligence Index found that ghost meetings accounted for 13–15% of booked time for most meeting rooms in its dataset. The study covered more than 180,000 spaces across 200+ companies and more than 140 million square feet of commercial real estate.
4. Average meeting duration
Average meeting duration shows how long rooms are typically used.
Formula: Average meeting duration = total meeting minutes ÷ number of meetings held
If employees spend 2,250 minutes in conference rooms across 50 meetings: 2,250 ÷ 50 = 45 minutes per meeting
Track both scheduled duration and actual duration when possible. If employees routinely reserve rooms for 60 minutes but leave after 35, the extra time can make availability look tighter than it really is.
As you may have guessed, there’s no universal ideal meeting duration. The gap between the time employees reserve and the time they actually need is what actually matters.
5. Booking density
Daily averages can hide your real room problem. An office might have plenty of conference room capacity overall and still run out every Wednesday at 11 a.m.
Booking density shows how concentrated reservations are during a particular time period.
One way to calculate it is: Booking density = (booked rooms during a time period ÷ rooms available during that period) × 100
If 18 of your 24 conference rooms are reserved at 10 a.m. on Tuesday: 18 ÷ 24 × 100 = 75% booking density
Plot this by hour and day of week. A heatmap can quickly show whether your problem is an overall lack of meeting rooms or a few recurring periods when demand spikes.
6. Ghost meeting time
No-show rate counts abandoned reservations. Ghost meeting time measures how much booked capacity those reservations consume.
Formula: Ghost meeting time = (booked minutes with no room use ÷ total booked minutes) × 100
If rooms were reserved for 3,000 minutes during the week and 420 of those minutes went unused: 420 ÷ 3,000 × 100 = 14% ghost meeting time
This is especially useful for real estate planning because a one-hour unused reservation has a bigger impact on room availability than a 15-minute one.
Conference room analytics benchmarks: What does good look like?
There isn’t one ideal utilization rate for every workplace. Room mix, hybrid schedules, and peak-day demand all affect what “good” looks like.
Looking back at VergeSense’s Occupancy Intelligence Index, conference rooms averaged 20.5% active-time usage, while 13–15% of booked meeting-room time was ghosted. In a separate case study, Raymond James found that complaints about conference room availability typically began around 70% usage—a useful reminder that maximizing utilization isn’t always the goal.
Averages can also hide the moments when rooms are hardest to find, so pay close attention to peak periods rather than relying on one overall utilization rate.
How to collect conference room analytics
Start with the data you already have.
Calendar and room booking data can show reservations, booking duration, cancellations, room capacity, amenities, and peak booking periods. Check-in data helps confirm whether a booked room was actually claimed. Occupancy sensors can provide a more precise picture of physical presence and group size.
But remember: each source has a blind spot. Booking data captures intent, not necessarily real use. Sensors can capture presence without explaining why someone chose the room. Check-ins provide stronger confirmation than a calendar reservation but still depend on employee behavior.
For most workplace teams, the goal is to collect enough information to answer the decision in front of you—not collect every possible signal.
If you’re trying to reduce ghost meetings, booking and check-in data may be enough. If you’re considering replacing large conference rooms with smaller spaces, you’ll also want reliable information about meeting size and room capacity.
How to analyze your meeting room data
Start by defining your measurement window. Decide which hours count as available room time and use that same definition everywhere. Comparing a room measured from 8 a.m.–6 p.m. with one measured from 9 a.m.–5 p.m. will distort the results.
Then, establish a baseline before changing anything. Four to eight weeks of data will usually give you a better view of recurring patterns than a few isolated days, particularly in a hybrid workplace.
Next, segment the results. Look at individual rooms, room capacity, floor, location, day of week, and time of day. Portfolio-wide averages are useful for executives, but they’re often too broad to tell workplace teams what needs to change.
Finally, look for combinations of metrics rather than isolated numbers.
How to improve conference room utilization
Now that you understand the problem, it’s time to make a targeted change and measure again.
If ghost meetings are driving the gap, use check-ins and automatic room release so abandoned reservations go back into inventory. If employees consistently take oversized rooms, prompt them to move to a smaller available room. If meetings routinely finish early, make it easy to release the remaining reservation.
Conference room analytics can also uncover physical design problems. A room may be underused because it’s too warm, too far from the teams that need it, lacks reliable video conferencing equipment, or simply isn’t the size employees need.
Avoid treating every low-utilization room as wasted space. Some rooms exist for occasional large meetings, private conversations, interviews, or other needs that won’t produce high daily usage. Use the data to investigate the reason behind the number before removing capacity.
And don’t analyze rooms in isolation. Compare meeting-space patterns with office attendance and desk booking numbers. If attendance has increased without a corresponding increase in room capacity, higher meeting-room demand may be expected. If attendance is flat but room availability is getting worse, booking behavior or room mix may be the more likely problem.
—
The goal of conference room analytics isn’t to maximize every room to 100%. That’s very unlikely to happen. Instead, the goal is to use this data to make sure employees can find the right space when they need it without paying for more meeting-room capacity than the workplace actually requires.
Want to go deeper? See how workplace data can reveal where space is working, where it isn’t, and what to change next in our guide to space planning with workplace data.
Frequently asked questions about conference room analytics
What are conference room analytics?
Conference room analytics are data about how meeting spaces are booked and used. Common metrics include room utilization, occupancy, booking density, no-show rate, meeting duration, and room-capacity usage. These insights help workplace teams understand demand and make better decisions about meeting space design and availability.
How do you calculate conference room utilization?
Conference room utilization is typically calculated by dividing the number of hours a room is actually used by the number of hours it is available, then multiplying by 100. If actual occupancy data isn’t available, teams can calculate booked utilization instead using booked room hours.
What is a good conference room utilization rate?
There’s no magic number. What’s “good” depends on when people are in the office, how many rooms you have, and when demand spikes. Use benchmarks as a gut check, then look at your own room-level and peak-time patterns to see where availability is actually tight.
What’s the difference between conference room utilization and occupancy?
Utilization measures how often a room is used compared with how often it is available. Occupancy measures how much of the room’s capacity is being used while people are there. For example, an eight-person room can have high utilization but low occupancy if it is frequently used by only two people.
Read more
Envoy’s September 2026 releases help teams manage visitors with less manual work, streamline compliance reporting, and keep access systems in sync.
Envoy’s August 2026 releases introduce Envoy Response for emergency management, bringing emergency response into the same platform you already use for visitor and workplace management.

Envoy's July 2026 releases focus on workplace intelligence features like HRIS directory sync, workplace map file exports, and mailroom management improvements through the Developer API.

Envoy data across 300+ U.S. metros reveals the one morning the World Cup actually emptied the office, and it wasn't when you'd think.

Envoy Academy is back with a full refresh. Still free, still on-demand, and organized by role so admins get fluent in Envoy fast.
Envoy's June 2026 releases help you close gaps between physical and digital systems with smarter visitor data controls, seamless move management, and real-time workplace intelligence.