
Spring fever is real. The workplace data proves it.


Every April, the same thing happens. Employees mentally check out on Fridays. The data makes it visible: spring is consistently the season with the lowest Friday attendance share of the year, and the widest gap between the busiest and quietest days of the week. This pattern has been building for four years. It is not slowing down.
Spring is when the Friday early departure sets in
The spring fever story is not just about one season being different from the last. It is about where spring sits relative to the full year. When Friday's share of the week dips in spring, that shift represents a meaningful and measurable reduction in in-office time, one that compounds across the entire Envoy customer base.
Friday by season, averaged across 2022 to 2025
.png)
Averaged across all four years, Friday’s share of weekly entries by season breaks down as follows:
- Spring: 10.6% Friday share on average. The annual low across all four years of data.
- Summer: 10.8% Friday share on average. Slightly higher than spring, but the low-attendance behavior persists through the warmer months.
- Fall: 11.1% Friday share on average. Attendance nudges back toward baseline as the year winds toward year-end.
- Winter: 11.3% Friday share on average. The annual high. Offices are relatively fuller on Fridays in winter than at any other time of year — a 0.7 percentage point difference from spring that translates to roughly 11,000 entries per quarter.
The difference between winter and spring is 0.7 percentage points in raw Friday share. That sounds small until you put it in absolute terms: in spring 2025, there were more Monday logins than Friday logins. That gap has more than doubled since spring 2022. More telling still is what happens to the ratio: on average across four years, Monday is 41% busier than Friday in spring, compared to 31% busier in winter. Spring does not just lower Friday. It widens the gap between the front and back of the week to its annual peak.
The early departure instinct does not fully reverse
What makes the spring signal significant is not just that Friday dips in April. It is that the behavior established in spring does not fully reverse. In summer 2025, there were 212,264 Friday entries across the platform, compared to 160,539 in spring. Friday visits went up in absolute terms as overall attendance grew, but Friday’s share of the week (11.7%) remained well below winter levels (10.2% in winter 2025 — actually lower that year due to strong Monday growth). Across the full four-year average, summer and fall Friday share both sit below the winter baseline. The early departure habit that forms in spring is not fully reversed when the season changes.
This makes spring a critical window for workplace leaders. The habits that form between April and June tend to be the habits that persist. If Friday office attendance matters to an organization, spring is the moment to shape it, not revisit it in September.
Every spring, Fridays get quieter. Every year, the gap gets wider.
.png)
Offices have been getting busier. Total attendance is up nearly 40% compared to spring 2024, and the Envoy platform is now tracking more office entries in spring 2025 than at any point in 2022. The return to the office is real.
But that growth is not landing on Fridays.
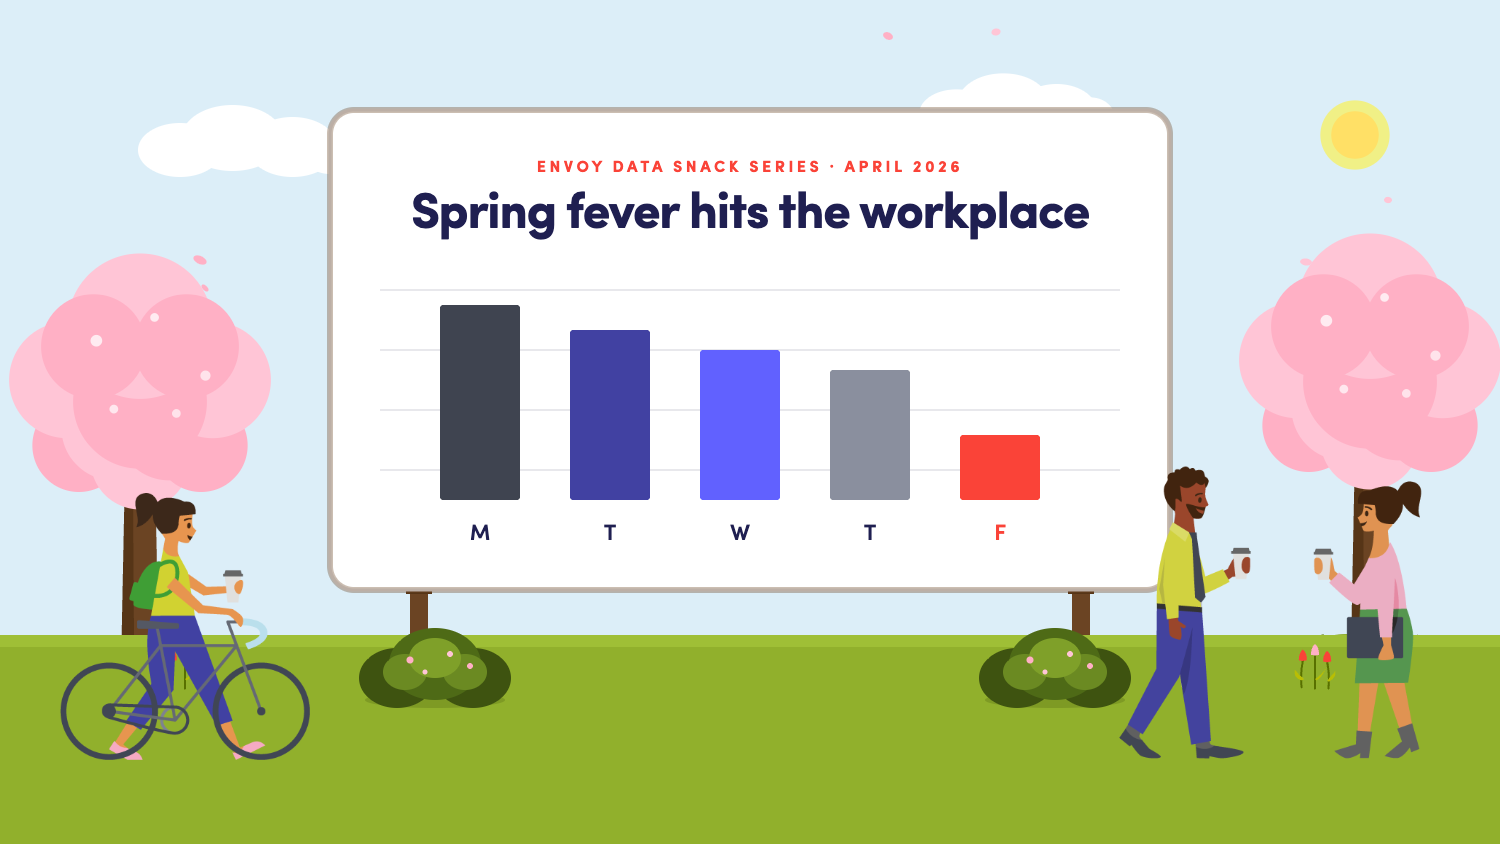
In spring 2025, Friday accounted for just 10.0% of weekly office entries. The average Monday through Thursday draws around 22% each. Friday draws less than half that. And every April, like clockwork, that gap between Monday and Friday stretches a little wider than it was the year before.
Four springs of data tell the same story

The Monday vs Friday share of weekly entries, measured each spring:
- Spring 2022: Monday at 14.4%, Friday at 11.7%. Monday was 23% busier than Friday.
- Spring 2023: Monday at 14.7%, Friday at 10.3%. Monday was 43% busier than Friday.
- Spring 2024: Monday at 15.0%, Friday at 10.3%. Monday was 46% busier than Friday.
- Spring 2025: Monday at 15.5%, Friday at 10.0%. Monday is now 55% busier than Friday.
In spring 2022, Monday was 23% busier than Friday. By spring 2025, that gap had grown to 55%. The spring Friday fade is not a blip. It is a pattern that gets more pronounced every year. The seasonal data makes this concrete.
Across all four years in this dataset, spring has the lowest average Friday attendance share of any season: 10.6%, compared to 11.3% in winter, 10.9% in summer, and 11.0% in fall. The Monday-to-Friday ratio also peaks in spring at 1.41x, higher than any other time of year.
Spring is not just when the workweek feels uneven. It is when the data confirms it is.
What is actually driving this
The Friday drop is not a dramatic seasonal crash. It is better understood as an early departure: when spring arrives, employees who have any flexibility over their schedules quietly redirect it toward Fridays first. The data shows this is the most reliable pattern in four years of workplace attendance. Friday’s share of weekly entries fell from 13.4% in early 2022 to around 10% by spring 2023, and has held there. Spring is when it sets for the year.
Meanwhile, Monday has been on a slow climb, rising from 15.2% in early 2022 to 16.6% in early 2026. The workweek is not collapsing; it is consolidating. Mid-week is getting denser, and Friday is absorbing that shift as the day employees protect most when they have flexibility over where they work.
Spring accelerates this pattern because it is when employees start exercising that flexibility again after winter. But the underlying behavior is structural, not seasonal. Spring just makes it visible. Early 2026 data reinforces this. In the first months of 2026, Monday reached 16.6% of weekly entries, its highest share in four years of data. Friday came in at 11.1%, holding near its floor. The Monday-to-Friday ratio of 1.50x heading into spring 2026 is nearly identical to where it stood a year ago, suggesting the pattern is now stable rather than still accelerating.
The workweek has a new shape
Step back from the Friday story and the broader picture comes into focus. The five-day office week is still on the calendar. In practice, most of the work is happening across four of those days, with one emerging as the clear center of gravity.

Tuesday is the new peak day
Tuesday has quietly become the busiest day in the office, edging out Wednesday for the top spot over the last several quarters. In spring 2025, Tuesday accounted for 25.1% of weekly entries, with Wednesday close behind at 24.7%. Monday came in at 15.5%.
Put the full week in order: Tuesday at 25.1%, Wednesday at 24.7%, Thursday at 22.7%, Monday at 15.5%, Friday at 10.0%. The four days from Monday through Thursday collectively account for 90% of all office entries. Friday accounts for one in ten.In early 2026, Monday climbed further to 16.6%, its highest point in this dataset. Tuesday also nudged up to 25.8%. The mid-week and Monday consolidation is continuing into the new year.
The new office week: Tuesday and Wednesday draw the most traffic. Thursday is a strong third. Monday is climbing. Friday is in its own category at the bottom, with less than half the share of any other weekday.
How the week has shifted since 2022
.png)
Comparing spring 2022 with spring 2025 shows where the movement has gone:
- Tuesday: up from 24.2% to 25.1%, gaining nearly a full percentage point
- Monday: up from 14.4% to 15.5%, gaining 1.1 percentage points
- Friday: down from 11.7% to 10.0%, losing 1.7 percentage points
The numbers look modest in isolation. The significance is in their consistency. Every year, in every spring dataset, the same direction holds: mid-week grows, Friday shrinks. Early 2026 adds another data point: Monday at 16.6% is up 1.7 percentage points from early 2024, and Tuesday at 25.8% is up nearly a full point over the same period.
Not all industries treat the workweek the same way
The Friday effect varies substantially by sector. Some industries have essentially written Friday off as an in-office day. Others show more evenly distributed attendance, reflecting workforces organized around client availability or operational schedules rather than corporate calendar norms.
.png)
Tech and Finance lead the Friday fade
In spring 2025, the sectors with the lowest Friday attendance share were:
- Retail and CPG: 7.9%, the lowest of any sector tracked, reflecting long-standing non-traditional scheduling
- Tech: 8.6%, despite (or perhaps because of) the most schedule-flexible work cultures
- Finance: 8.7%, with Wednesday as the clear peak day at 26.0% of weekly entries
- Media and Entertainment: 10.0%
- Healthcare: 11.9%, the highest Friday share among knowledge-work sectors
Finance is notable not just for its low Friday number but for its Wednesday-centricity. Wednesday accounts for 26.0% of Finance’s weekly entries in spring 2025, compared to the national average of 24.7%. This likely reflects the consolidation of client meetings, leadership reviews, and team syncs around a midweek anchor.
Healthcare’s comparatively stronger Friday shows up in data because patient care, clinical schedules, and operational roles do not compress into a Tuesday-to-Thursday window the way knowledge work often does.
Real Estate: the sector that holds Friday
Real Estate shows the most resilient Friday attendance of any knowledge-work sector, at 13.8% in spring 2025, well above the national average of 10.0%. Monday is also strong at 18.2%. This pattern points to a workforce organized around client availability and property activity rather than internal calendar norms, with genuine business reasons to be in the office across the full week.
Company size shapes the week differently
The Tuesday-peak, Friday-trough pattern holds across organizations of every size, but the degree of compression varies. Mid-size and large companies have seen the sharpest shifts since 2022.
.png)
Mid-size companies show the strongest mid-week pull
At companies with 100 to 499 employees, Tuesday’s share of weekly entries grew from 22.9% in early 2022 to 24.7% in spring 2025, while Friday fell from 13.4% to 9.9%. At organizations with 500 to 999 employees, Tuesday climbed from 22.3% to 25.2% as Friday dropped from 13.1% to 10.3%.
This likely reflects structured hybrid policies at mid-size organizations that specify particular in-office days, concentrating attendance in the Tuesday-to-Thursday window more effectively than at either smaller or very large organizations.
Smaller companies still show up on Fridays
Organizations with under 100 employees have the highest Friday share, at 12.1% in spring 2025, compared to 9.9% at mid-size companies and 10.5% at large enterprises. Smaller teams tend to operate on trust-based cultures with more genuine flexibility, which appears to make it easier to actually choose Friday rather than treat it as the default remote day.
Interestingly, Monday share is highest at small companies at 17.8%, suggesting that when you work closely with a small team, the start of the week carries more pull.
Where you work shapes when you work
The national Friday average of 10.0% in spring 2025 hides a wide range of local behavior. Some markets have essentially eliminated Friday as an in-office day. Others look nothing like the national pattern at all.
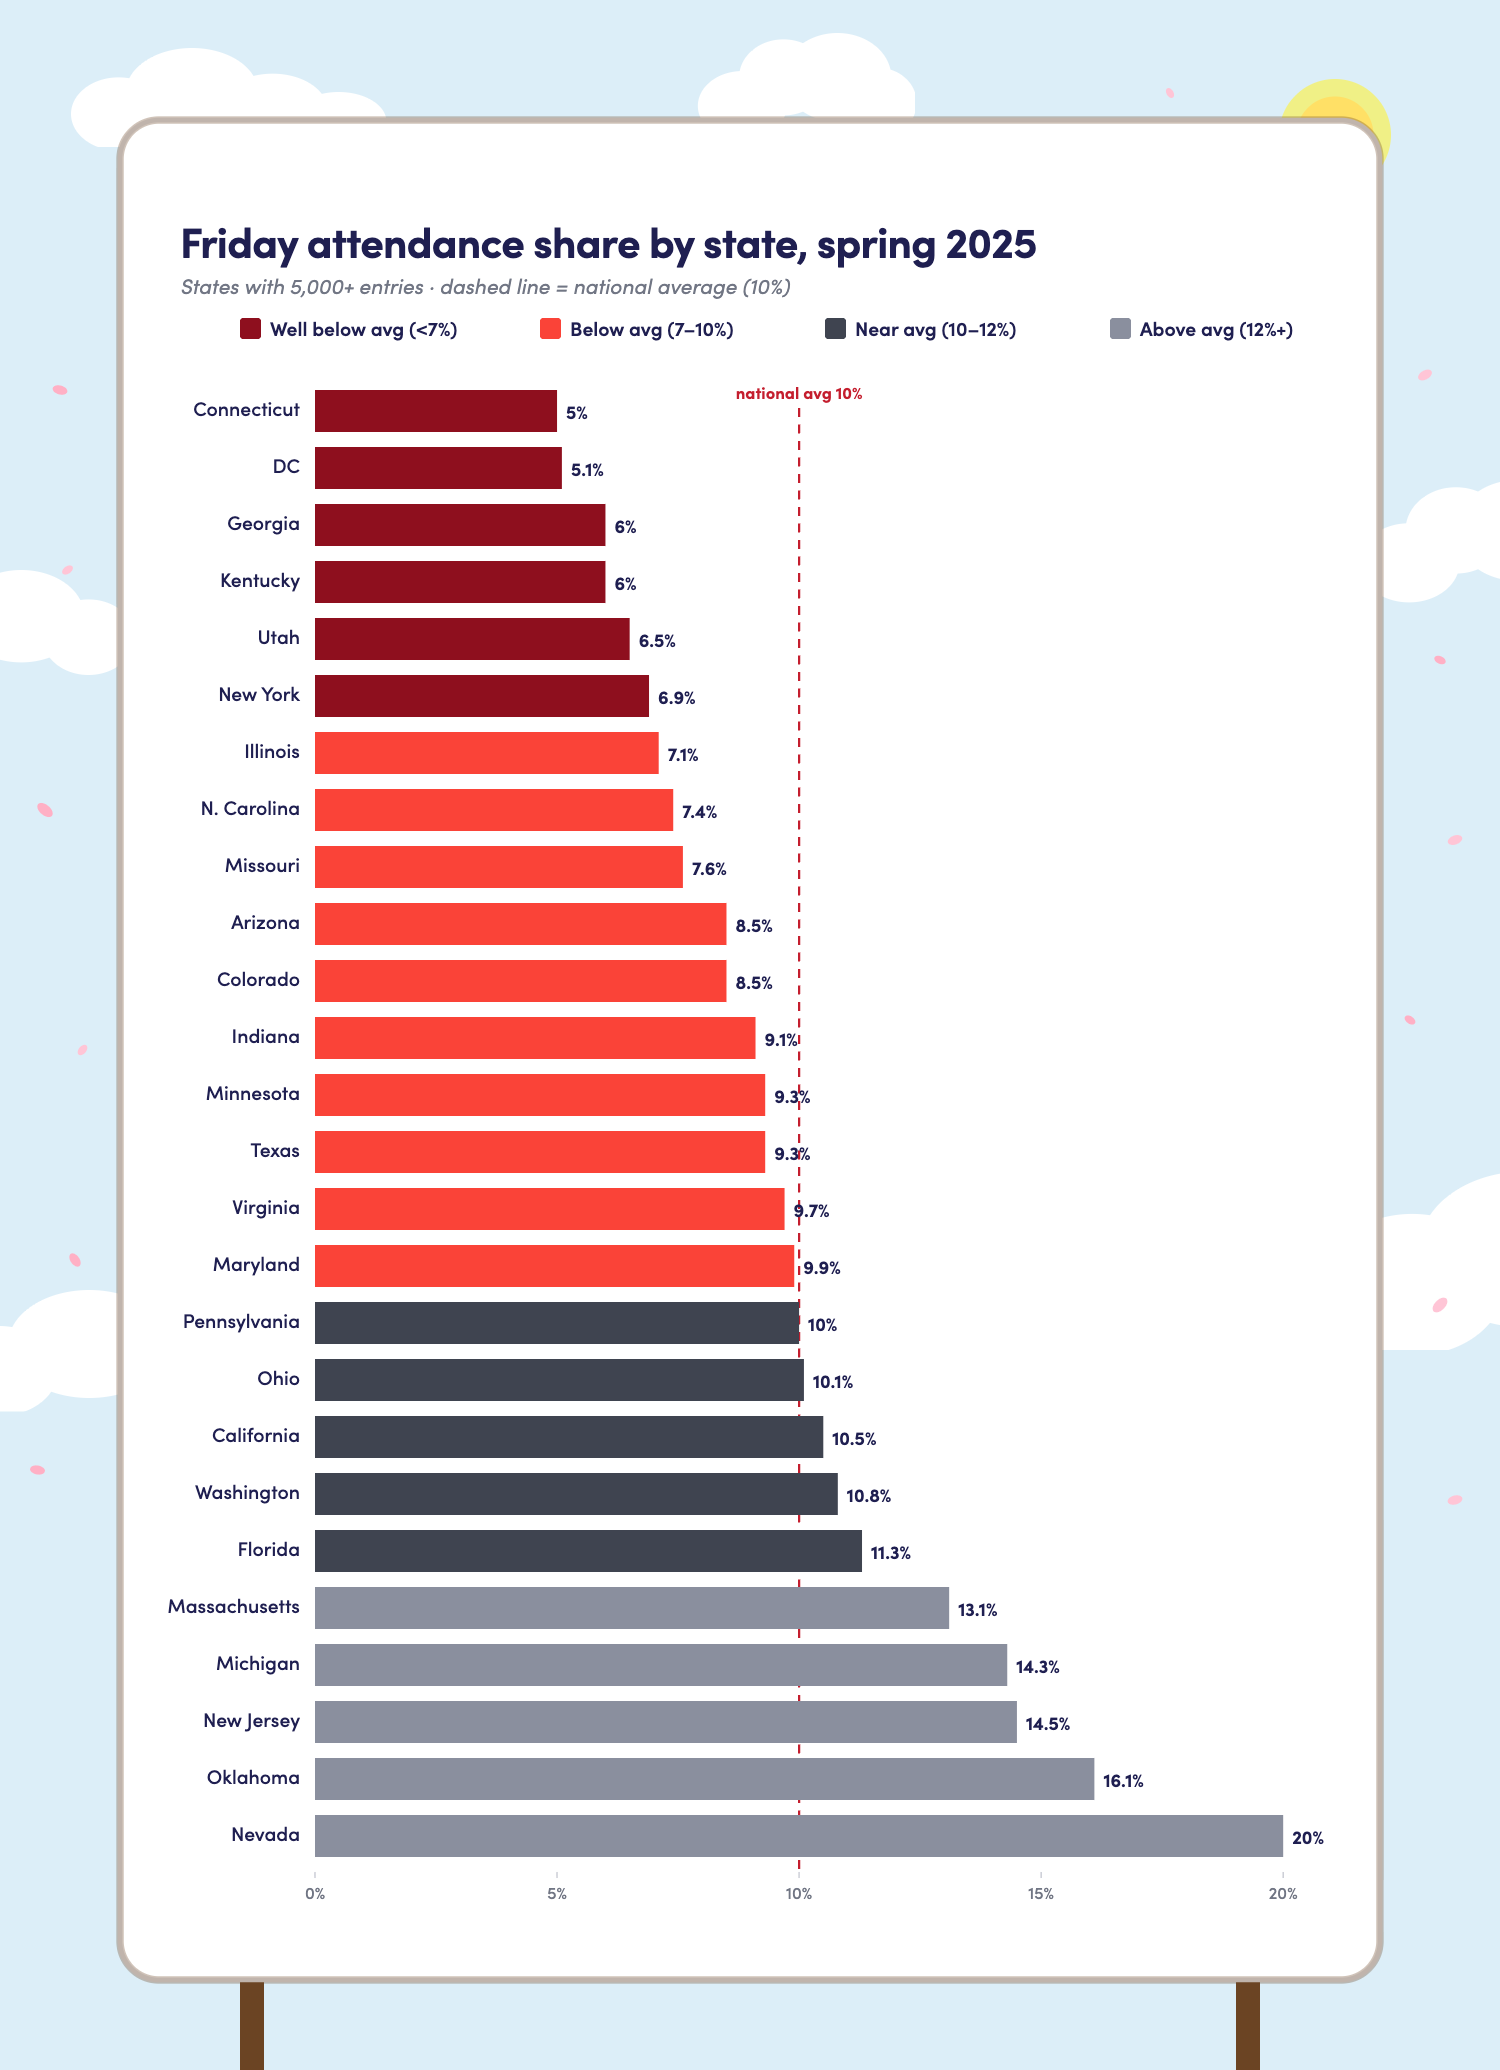
Friday nearly disappears in some markets
Connecticut and Washington DC had the lowest Friday share of any major market in spring 2025, at 5.0% and 5.1% respectively. These are markets dominated by financial services, professional services, and government-adjacent work, where structured hybrid policies and client-driven calendars appear to concentrate attendance tightly in the middle of the week.
Utah came in at 6.5%, with Wednesday drawing a remarkable 31.6% of the state’s weekly entries, reflecting heavily concentrated in-office mandates with a strong midweek anchor. New York followed at 6.9%, where Tuesday draws 28.1% of weekly entries, the signature profile of a financial and professional services hub.
Nevada: a week where every day looks the same
Nevada presents the most unusual attendance pattern in the dataset. In spring 2025, its five weekdays were distributed almost evenly: Monday 18.9%, Tuesday 20.6%, Wednesday 19.1%, Thursday 21.4%, Friday 20.0%. No single day dominates, and Friday is barely below the rest of the week.
This is the inverse of the national pattern, and the most likely explanation is Nevada’s industry mix, which skews heavily toward hospitality, gaming, and convention work. Office attendance in those sectors does not follow knowledge-work norms. Nevada serves as a useful reminder that national trends have real exceptions.
Across the country: The national Friday average of 10% in spring 2025 hides a range from 5% in Connecticut and DC to 20% in Nevada. Geography matters as much as policy when it comes to the actual shape of the workweek.
What this means for workplace leaders
The patterns in this data are not predictions. They are descriptions of decisions already being made, across millions of office entries, by employees navigating hybrid work in the real world. Three things stand out.
Space planning needs a day-of-week lens
A workspace sized for peak Tuesday occupancy looks very different from one sized for average weekly load. With Friday drawing less than half the traffic of peak days, organizations that plan capacity around peak demand are carrying significant unused inventory three or four days a week. Understanding the day-of-week profile by team, by floor, and by location is now as important as understanding total headcount.
Spring is when attendance patterns set for the year
The data consistently shows that spring is when the Monday-Friday gap reaches its annual peak and when Friday attendance is at its lowest point of the year. It is also when employee habits for the rest of the year tend to get established. The early departure instinct that shows up in spring attendance data does not fully reverse in summer or fall. Organizations that want to shape how people distribute their in-office time have the most leverage in the first few months of the year, before spring inertia sets in.
Vague return-to-office policies default to Friday avoidance
The Monday-to-Friday attendance ratio growing from 1.23x in spring 2022 to 1.55x in spring 2025 tells a clear story. When employees have discretion over which days to come in, Friday is the day they protect most. Return-to-office mandates that specify a number of days without specifying which days will consistently see Friday become the path of least resistance. The data suggests this pattern is not self-correcting.
The four-day office week is already here
No company voted for it. No policy announced it. But four years of data from Envoy workplace platform, extending into early 2026, tells a consistent story: in-office work has consolidated around a Tuesday-to-Thursday core, Monday is climbing, and Friday has become a shoulder day for most knowledge workers.
Total office attendance is growing. Monday just hit its highest share on record. Offices are busier and more front-loaded than at any point in this dataset. But that activity is flowing into the four days that matter most to employees, and away from the one they have quietly decided to protect.
Spring just makes it easier to see.
Methodology
Data reflects aggregated, anonymized workplace entry signals from the Envoy platform, covering 2022 through early 2026. All day-of-week figures represent the share of total weekly entries attributed to each day within a given period. Data covers customers across the United States. Industry and company size breakdowns use Envoy customer segmentation. Individual customer data is not identifiable in any reported figure. Total entry counts reflect platform usage across Envoy’s customer base and should not be interpreted as a census of U.S. office attendance.
Read more

Envoy data across 300+ U.S. metros reveals the one morning the World Cup actually emptied the office, and it wasn't when you'd think.

Envoy Academy is back with a full refresh. Still free, still on-demand, and organized by role so admins get fluent in Envoy fast.

Envoy's June 2026 releases help you close gaps between physical and digital systems with smarter visitor data controls, seamless move management, and real-time workplace intelligence.

Envoy's May 2026 updates give workplace teams full-lifecycle emergency response, real-time integration visibility, and more efficient move management.

Plug-and-play workplace signage built for security, safety, and compliance.

Workplace, security, and real estate leaders share what actually makes a modern workplace work. Hosted by Matt Tverberg. New episodes every other Thursday. 🎧