

Office space utilization: How to measure it, calculate it, and improve it



Your office can look half-empty on average and still feel packed on Tuesday.
That’s the problem with looking at utilization as a single number. In 2026, JLL reported 56% global office utilization against a target of roughly 74%, while CBRE reported 53% average building utilization and 80% peak utilization.
To make smarter space decisions, you need to know not just how much space gets used, but when, where, and how consistently. Here’s how to measure office utilization, calculate the metrics that matter, and turn the data into better workplace decisions.
What is office utilization?
Office space utilization is a measure of how much available workplace capacity is actually used during a defined period.
At the building level, that might mean comparing the number of people onsite with the building’s capacity. At the space level, it might mean measuring how frequently desks, rooms, or other work areas are occupied during available hours.
Office utilization is different from simply knowing how much space you have. A company may lease a 500-seat office, for example, but regularly use only 250 of those seats. It’s also different from attendance. Attendance tells you who came to the workplace. Utilization tells you how much of the workplace they actually used.
Office utilization vs. occupancy vs. attendance
These terms are related and often confused. But they’re not exactly the same.
A workplace can have low average utilization and high peak occupancy at the same time. That is why relying on a single metric can lead to the wrong space decision.
What is a good office utilization rate?
There’s no single utilization rate that’s right for every workplace. Company size, work patterns, industry, office design, and employee schedules all affect how much capacity a business needs.
Current benchmarks can still provide a useful reference point.
JLL’s 2026 Global Occupancy Planning Benchmark Report found that global office utilization reached 56%, up from 54% in 2025 and 49% in 2024. The gap between actual and target utilization was 18 percentage points, putting the average target at roughly 74%.
CBRE’s 2026 Global Workplace & Occupancy Insights reported 53% average building utilization and 80% average peak utilization. CBRE also found that 87% of organizations now set explicit building-utilization targets, with nearly half targeting 76%–85% utilization.
The best target is one that makes efficient use of space without creating capacity problems on peak days.
How to calculate office space utilization
There’s no single utilization rate that’s right for every workplace. Company size, work patterns, industry, office design, and employee schedules all affect how much capacity a business needs.
A strong utilization program tracks several metrics together. Each reveals a different part of the space-demand picture.
1. Office utilization rate
Formula: Utilization rate = occupied capacity ÷ available capacity × 100
If your office has 500 usable seats and an average of 325 are occupied during your measurement window: 325 ÷ 500 × 100 = 65% utilization
For more precise desk or room analysis, calculate utilization using time: Time-based utilization = occupied seat-hours ÷ available seat-hours × 100
If 100 desks are available for eight hours, they provide 800 available seat-hours. If employees occupy those desks for a combined 520 hours: 520 ÷ 800 × 100 = 65% utilization
What good looks like: Again, there’s no universal target. In current 2026 benchmarks, organizations commonly set building-utilization targets above 65%, with JLL reporting an approximate 74% global target and CBRE finding that nearly half of organizations with targets aim for 76%–85%.
2. Occupancy rate
Formula: Occupancy rate = people currently onsite ÷ total capacity × 100
If 400 people are onsite in an office designed for 500: 400 ÷ 500 × 100 = 80% occupancy
Occupancy is a point-in-time measurement. It is especially useful for identifying the busiest hours of the day.
What good looks like: Avoid treating 100% occupancy as the goal. Some capacity buffer helps absorb demand spikes, visitors, team events, and day-to-day variation. CBRE reported average global peak utilization of 80% in 2026 and cautioned that higher peak utilization can create overcrowding and employee-experience challenges.
3. Peak utilization
Peak utilization measures usage during the busiest period rather than across the full measurement window.
Formula: Peak utilization = highest observed occupancy ÷ available capacity × 100
If a 500-person office reaches 440 occupants at its busiest point: 440 ÷ 500 × 100 = 88% peak utilization
Track peaks by both day of week and time of day. Weekly averages can hide short periods when demand exceeds the practical capacity of a workplace.
CBRE’s 2026 research illustrates the difference: average building utilization was 53%, while average peak utilization reached 80%.
4. Peak-to-average utilization ratio
This metric shows how uneven demand is.
Formula: Peak-to-average ratio = peak utilization ÷ average utilization
If average utilization is 55% and peak utilization is 82%: 82 ÷ 55 = 1.49
That means the office is roughly 1.5 times as busy at peak periods as it is on average.
A larger gap makes space planning harder. It may indicate that the organization needs to coordinate schedules, adjust shared-seat ratios, or redistribute demand rather than simply add more space.
5. Office density
Density measures how much physical space is provided per person or seat.
Formula: People density = total office square footage ÷ assigned population or Seat density = total office square footage ÷ number of seats
For example, a 50,000-square-foot office supporting 300 people has a people density of: 50,000 ÷ 300 = 167 square feet per person
CBRE reported global averages of 158 square feet per person and 190 square feet per seat in its 2026 benchmark.
Be consistent about whether you use rentable, usable, or occupiable square footage. Mixing different area definitions makes site-to-site density comparisons unreliable.
6. Cost per seat
Cost per seat translates your space footprint into a financial metric.
Formula: Cost per seat = annual workplace occupancy costs ÷ total usable seats
Include costs consistently. Depending on the analysis, that might include rent, operating expenses, utilities, facilities services, furniture, and other workplace costs.
For a hybrid workplace, cost per occupied seat can be even more useful: Cost per occupied seat = annual workplace occupancy costs ÷ average number of occupied seats
There’s no meaningful universal dollar target because office costs vary dramatically by market, building type, lease structure, and service level. Instead, compare cost per seat and cost per occupied seat:
- Across similar locations
- Against the site’s annual budget
- Against previous periods
- Before and after a space change
A lower cost per seat is not automatically better if the change creates overcrowding or worsens the workplace experience.
7. Desk and room utilization
For individual spaces:
Space utilization = occupied time ÷ available time × 100
This lets you compare demand for specific room sizes, desk neighborhoods, collaboration spaces, phone booths, and other workplace resources.
It’s also useful to compare booked utilization with actual utilization. A reservation represents intended use; a check-in or occupancy signal provides stronger evidence that the space was actually used.
How to measure office space utilization
Reliable space utilization analysis starts before you open a dashboard. You need a consistent measurement methodology so the numbers mean the same thing across locations and over time.
1. Start with the decision you need to make
Define the business question before deciding which data to collect.
For example:
- Lease decision. Do we have more space than we need?
- Floor planning. Which floors are consistently over- or underused?
- Desk planning. Do we have the right number of desks for peak demand?
- Meeting space. Do room sizes match actual meeting sizes?
- Workplace operations. Which days require more food, facilities support, or other resources?
- Hybrid policy. How does actual onsite activity compare with expected attendance?
Different questions require different levels of data. Building-level occupancy may be enough for a lease analysis. Reconfiguring meeting rooms requires room-level usage and capacity data.
2. Define your denominator
Utilization percentages are only as accurate as the capacity number underneath them.
Before measuring, establish:
- Which desks and rooms are currently usable
- Maximum or practical capacity for each area
- Which employees belong to each location
- Which days count as normal working days
- Which hours make up the measurement window
- Which square-footage definition you use
Remove decommissioned desks, closed floors, construction zones, and other unavailable capacity from the denominator. Otherwise, your utilization rate may appear artificially low.
3. Combine the right data sources
No single workplace data source answers every utilization question.
- Access control and badge data. Useful for measuring building entry and employee presence. It won’t tell you which desk or room someone used.
- Wi-Fi data. Helps identify building- or floor-level presence patterns. A connected device doesn’t always mean someone is actively using a space.
- Desk and room reservations. Shows demand, bookings, and intended use. A reservation doesn’t prove someone showed up.
- Check-ins. Can confirm that a reserved resource was used. Accuracy depends on employees actually completing the check-in.
- Occupancy sensors. Provide more precise data about whether desks, rooms, or zones are occupied. They also add hardware, implementation, and privacy considerations.
- Visitor management data. Shows guest volume and visitor presence. You’ll generally want to distinguish visitor activity from employee attendance.
- HRIS data. Provides headcount, team, and location assignments. It tells you who belongs to a site, not who actually used it.
- Lease and finance data. Helps calculate costs per square foot, seat, or employee. You’ll need consistent cost definitions to compare locations accurately.
Badge data remains one of the most common building-level sources. In CBRE’s 2024 Workplace & Occupancy Management Technology report, 81% of participants measured space utilization, and 96% of those organizations used badge-swipe data.
For more granular analysis, combine building-presence signals with reservations, check-ins, or sensor data.
4. Normalize the data across locations
A portfolio-wide utilization number is only useful when each site is measured consistently.
Here’s what to standardize:
- Working days
- Business hours
- Time zones
- Capacity definitions
- Seat inventories
- Square-footage definitions
- Employee versus visitor presence
- Space categories
- Measurement intervals
Don’t calculate portfolio utilization by simply averaging percentages from individual sites. Weight each site by its available capacity.
Portfolio utilization = total occupied capacity across all sites ÷ total available capacity across all sites × 100
For example, a 50-seat office and a 1,000-seat headquarters should not contribute equally to the portfolio average.
5. Measure over enough time to see a pattern
A single day is a snapshot, not a utilization strategy. Team events, holidays, weather, company meetings, and local schedules can distort short measurement periods.
For hybrid workplaces, use a rolling multiweek view and compare:
- Day of week
- Hour of day
- Average utilization
- Peak utilization
- Median utilization
- Location
- Floor
- Department or team
- Space type
Longer-term trends are especially important before making expensive decisions such as closing a floor or reducing a lease footprint.
6. Compare average and peak demand
Never report average utilization without also reviewing peak usage. Average utilization helps answer: How efficiently are we using the space we pay for?
Peak utilization helps answer: Will the workplace still function when the most people show up?
You need both to right-size space safely.
For example, reducing capacity based on a 50% weekly average may look financially efficient. But if occupancy reaches 90% every Tuesday, removing too many desks could create an immediate capacity problem.
7. Validate one data source against another
Every workplace data source has blind spots. Cross-checking signals makes your conclusions stronger. For example:
- Compare badge entries with Wi-Fi presence
- Compare desk bookings with check-ins
- Compare room reservations with actual attendance
- Compare sensor usage with employee feedback
- Compare onsite headcount with available desks
When two sources disagree, investigate the reason rather than automatically choosing one.
8. Act, then measure again
Utilization analysis should lead to a decision. You might:
- Convert underused large meeting rooms into smaller rooms
- Increase shared seating on low-demand floors
- Add desks where peak demand regularly exceeds supply
- Consolidate teams onto fewer floors
- Adjust amenities around the days employees actually come onsite
- Release unused bookings automatically
- Reconfigure spaces that employees consistently avoid
After making the change, measure the same metrics again. This closes the loop between data, decision, and outcome.
Common office utilization measurement mistakes
Even good data can produce bad decisions when it is measured inconsistently.
The goal is to produce data that is consistent enough to support a decision, not to produce the largest possible dataset.
How often should you measure office utilization?
Office utilization should be measured continuously when the underlying systems support it, then reviewed over time. Different decisions call for different reporting windows:
- Daily and weekly data helps workplace teams manage staffing, amenities, and immediate capacity
- Monthly trends reveal recurring attendance and space-use patterns
- Quarterly data is more useful for major layout, portfolio, and budgeting decisions
- Year-over-year comparisons show whether workplace policies and real estate changes are having a lasting effect
As a best practice, never make major portfolio decisions from a single week of data.
How to improve office space utilization
Improving utilization does not mean trying to fill every seat. The goal is to align your space with real demand while leaving enough flexibility for employees to work effectively during busy periods.
Coordinate when people come onsite
Hybrid schedules often create concentrated demand on a few days. CBRE’s 2026 research found that Tuesday was the highest-attendance day for 73% of surveyed organizations.
If one day is routinely crowded while others remain quiet, better team coordination can smooth demand without adding square footage.
Match seating to actual attendance
Assigned desks can sit empty when employees work remotely. Shared seating, neighborhoods, and desk lending can help organizations support more employees with the same physical footprint—as long as peak demand is measured before reducing seat counts.
CBRE found in 2026 that 69% of clients reported more than 40% of their population sharing desks.
Right-size meeting rooms
Look beyond whether a room is booked.
Here’s what to compare:
- Room capacity
- Number of attendees
- Booking duration
- Actual occupancy
- Cancellations and no-shows
If large rooms are regularly occupied by two or three people while small rooms are constantly full, the issue may be the mix of space, not the total amount of space.
Release unused space
Ghost meetings and abandoned desk reservations make available capacity look unavailable.
Check-in requirements and automatic release rules can return unused rooms or desks to employees who actually need them.
Repurpose consistently underused areas
Low utilization does not always mean you should eliminate space. First determine why it is underused. An empty area could indicate that:
- Employees do not need that type of space
- The furniture or equipment does not support their work
- The area is too noisy
- The location is inconvenient
- Employees do not know the space exists
Pair quantitative usage data with employee feedback before deciding what to change.
How Envoy helps teams understand and improve workplace utilization
Rising Ground increased room and desk utilization by 40–50% with Envoy while gaining real-time visibility into occupancy across locations. See how they did it.
That kind of visibility starts with bringing workplace data together. Envoy connects data across occupancy, attendance, desk and room usage, visitors, and more so teams can better understand how their spaces are being used.
Data can come from sources including access control systems, Wi-Fi, employee check-ins, visitor sign-ins, and desk and room reservations. Teams can then analyze patterns across individual locations or an entire portfolio. With Envoy, workplace teams can:
- Track occupancy and attendance. See how onsite activity changes by location, day, team, or other dimensions.
- Measure desk utilization. Understand which desks, floors, and neighborhoods employees use most.
- Analyze room demand. Review room bookings, capacity, cancellations, and other usage patterns.
- Compare space with cost. Use workplace and real estate data together to inform consolidation, repurposing, or expansion decisions.
- Identify peak periods. See when demand is highest instead of relying only on averages.
- Free up unused rooms. Check-in workflows and automatic release features help make abandoned bookings available again.
- Share workplace data. Customizable dashboards and reports help teams present utilization trends to workplace, real estate, finance, and leadership stakeholders.
Envoy also brings together data such as office attendance, meeting room utilization, and real estate costs to help teams identify opportunities to consolidate, repurpose, or expand space.
Want to get more from your workplace data? Download The workplace guide to actionable analytics for practical tips on turning utilization and occupancy insights into smarter space decisions.
Office space utilization FAQs
What’s the difference between office occupancy and utilization?
Occupancy measures how many people are in a space at a specific point in time compared with its capacity. Utilization measures how much available space is actually used over a period of time. You can think of occupancy as a snapshot and utilization as the broader usage pattern.
What is a good office utilization rate?
There isn’t a universal target. JLL’s 2026 benchmark reported an approximate global target of 74%, while CBRE found that nearly half of organizations with explicit targets aim for 76%–85% utilization. The right target should also account for peak demand, workplace type, employee schedules, and the amount of flexibility your organization needs.
How do you calculate office utilization?
A basic office utilization rate is calculated by dividing occupied capacity by available capacity and multiplying by 100. For more detailed analysis, calculate occupied seat-hours or room-hours as a percentage of the total hours those spaces were available.
What data should you use to measure office utilization?
Common sources include badge or access-control records, Wi-Fi presence, desk and room reservations, employee check-ins, occupancy sensors, visitor records, and HRIS data. Building-level questions can often be answered with access and presence data, while desk- or room-level decisions require more granular usage signals.
Can you measure office utilization without sensors?
Yes. Badge data, Wi-Fi connections, reservations, and check-ins can provide useful utilization data without dedicated occupancy sensors. Sensors are more useful when teams need precise information about whether individual desks, rooms, or zones are physically occupied.
Why should you measure peak utilization?
Peak utilization shows how much demand your workplace experiences at its busiest point. Average utilization can make an office appear underused even if employees regularly struggle to find desks or rooms on high-attendance days. Measuring both helps prevent organizations from reducing capacity too aggressively.
How long should you measure utilization before changing your office?
Use multiple weeks of normal workplace activity rather than a single day or week. Major decisions such as lease reductions or floor closures should be based on recurring patterns across a longer measurement period and account for seasonal variation, holidays, and unusual company events.
Read more
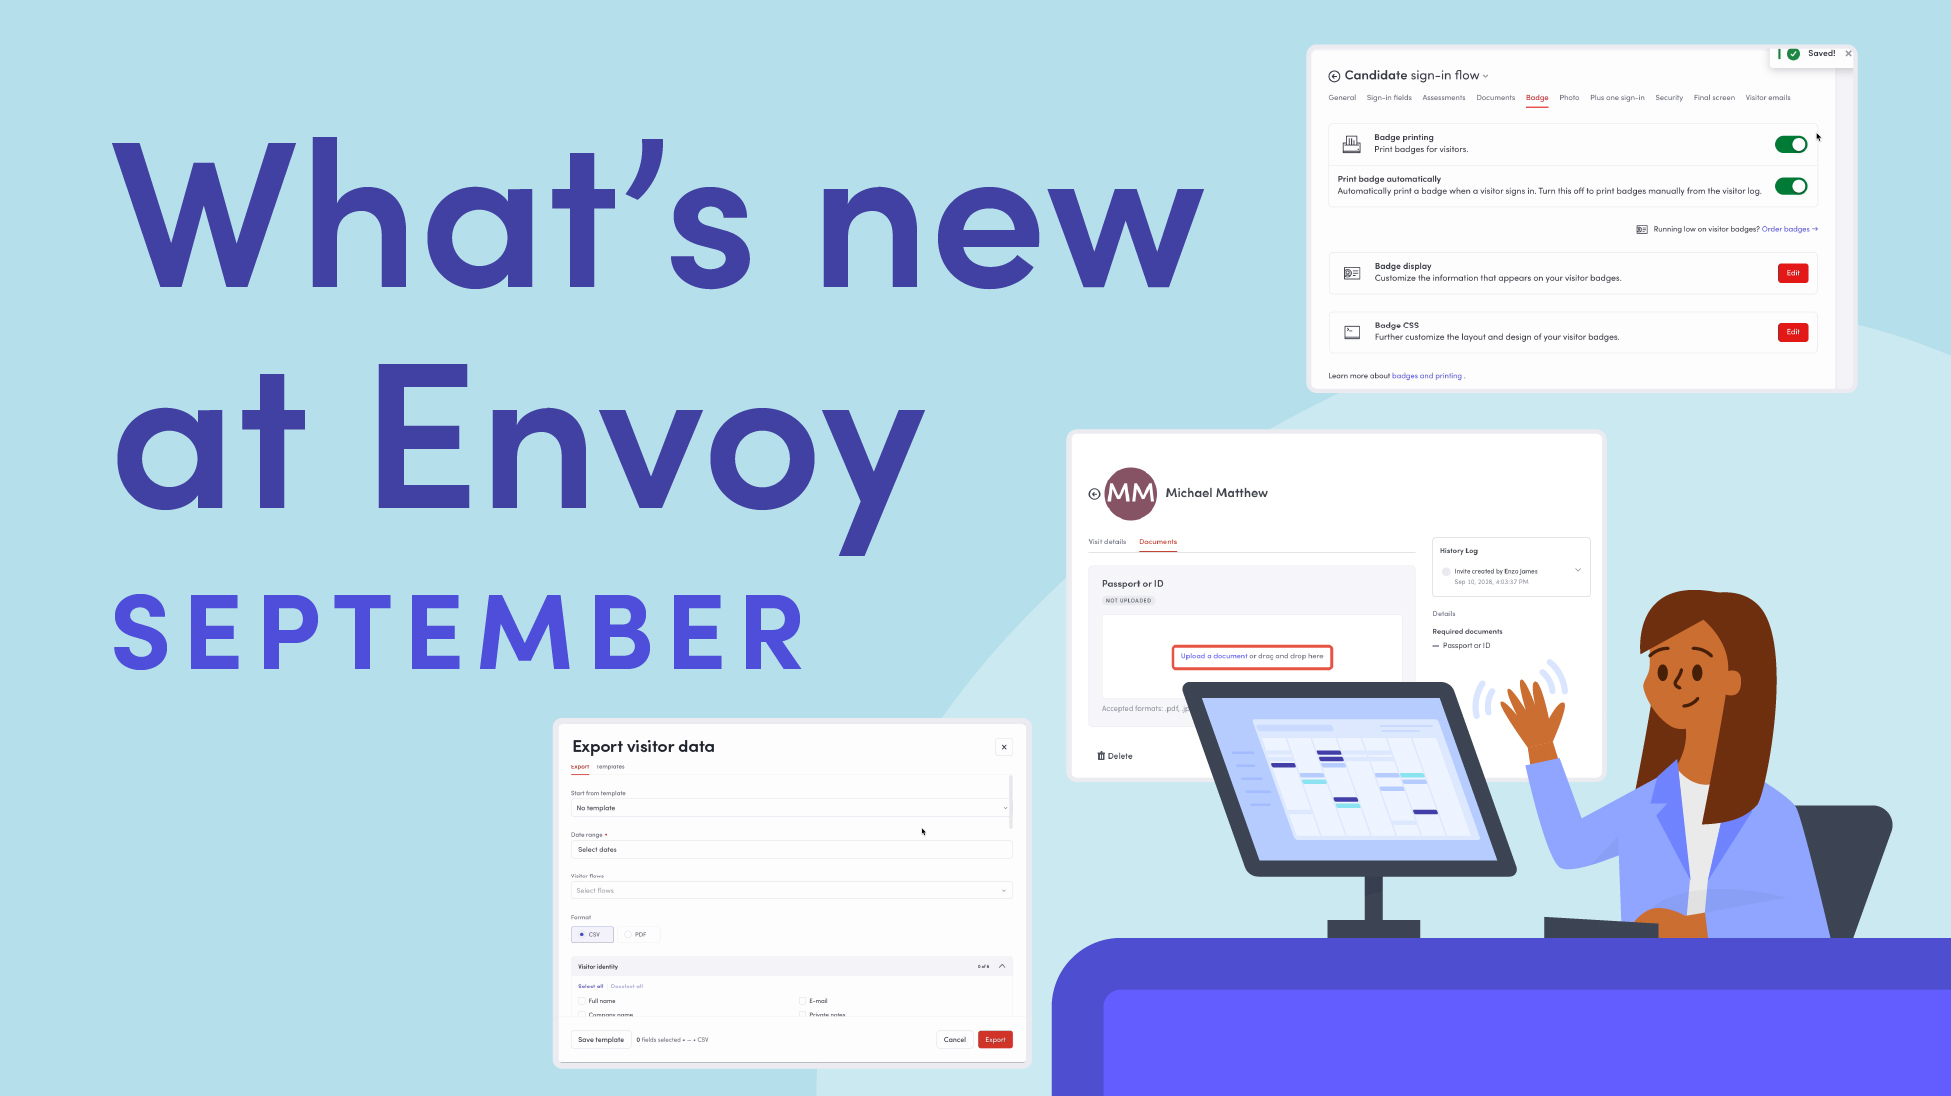
Envoy’s September 2026 releases help teams manage visitors with less manual work, streamline compliance reporting, and keep access systems in sync.
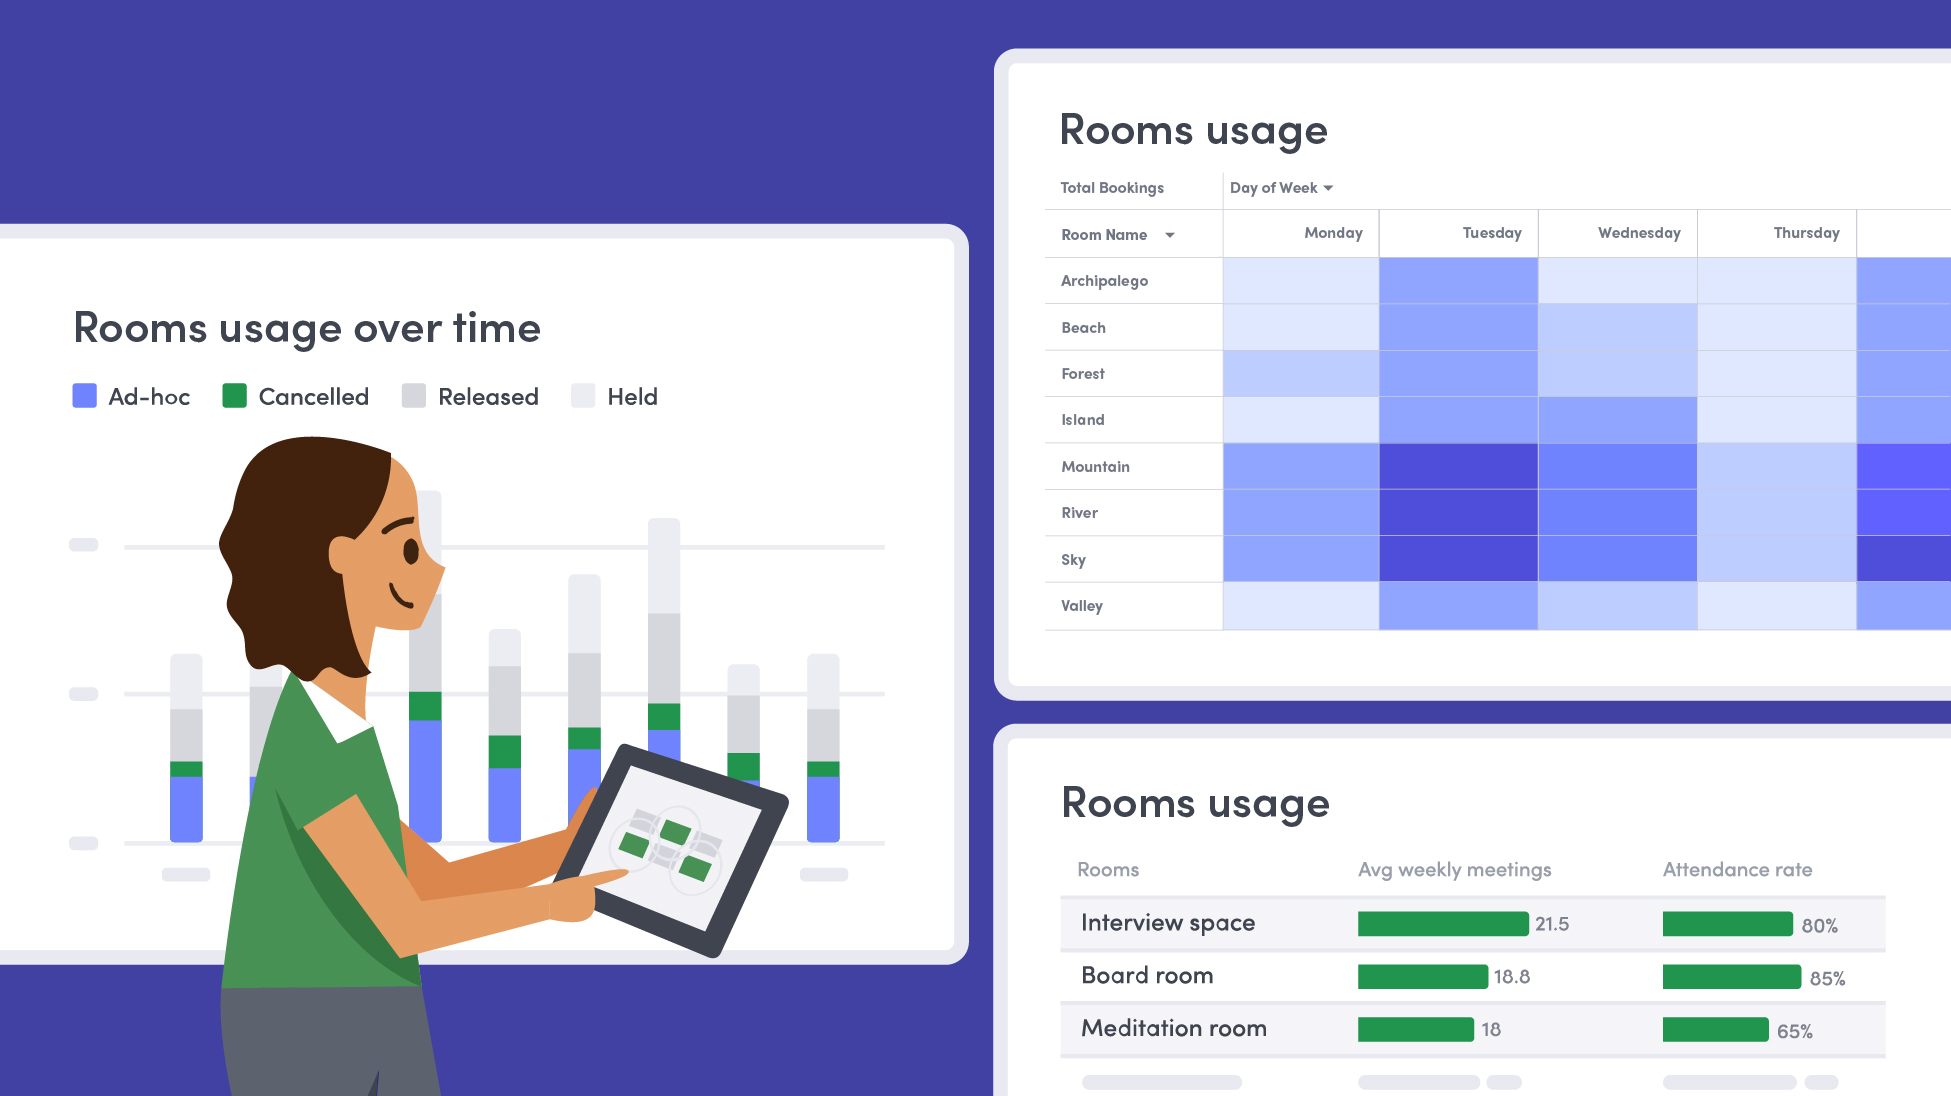
Learn how to measure conference room utilization, occupancy, no-shows, booking density, and more, and use the data to make smarter space decisions.
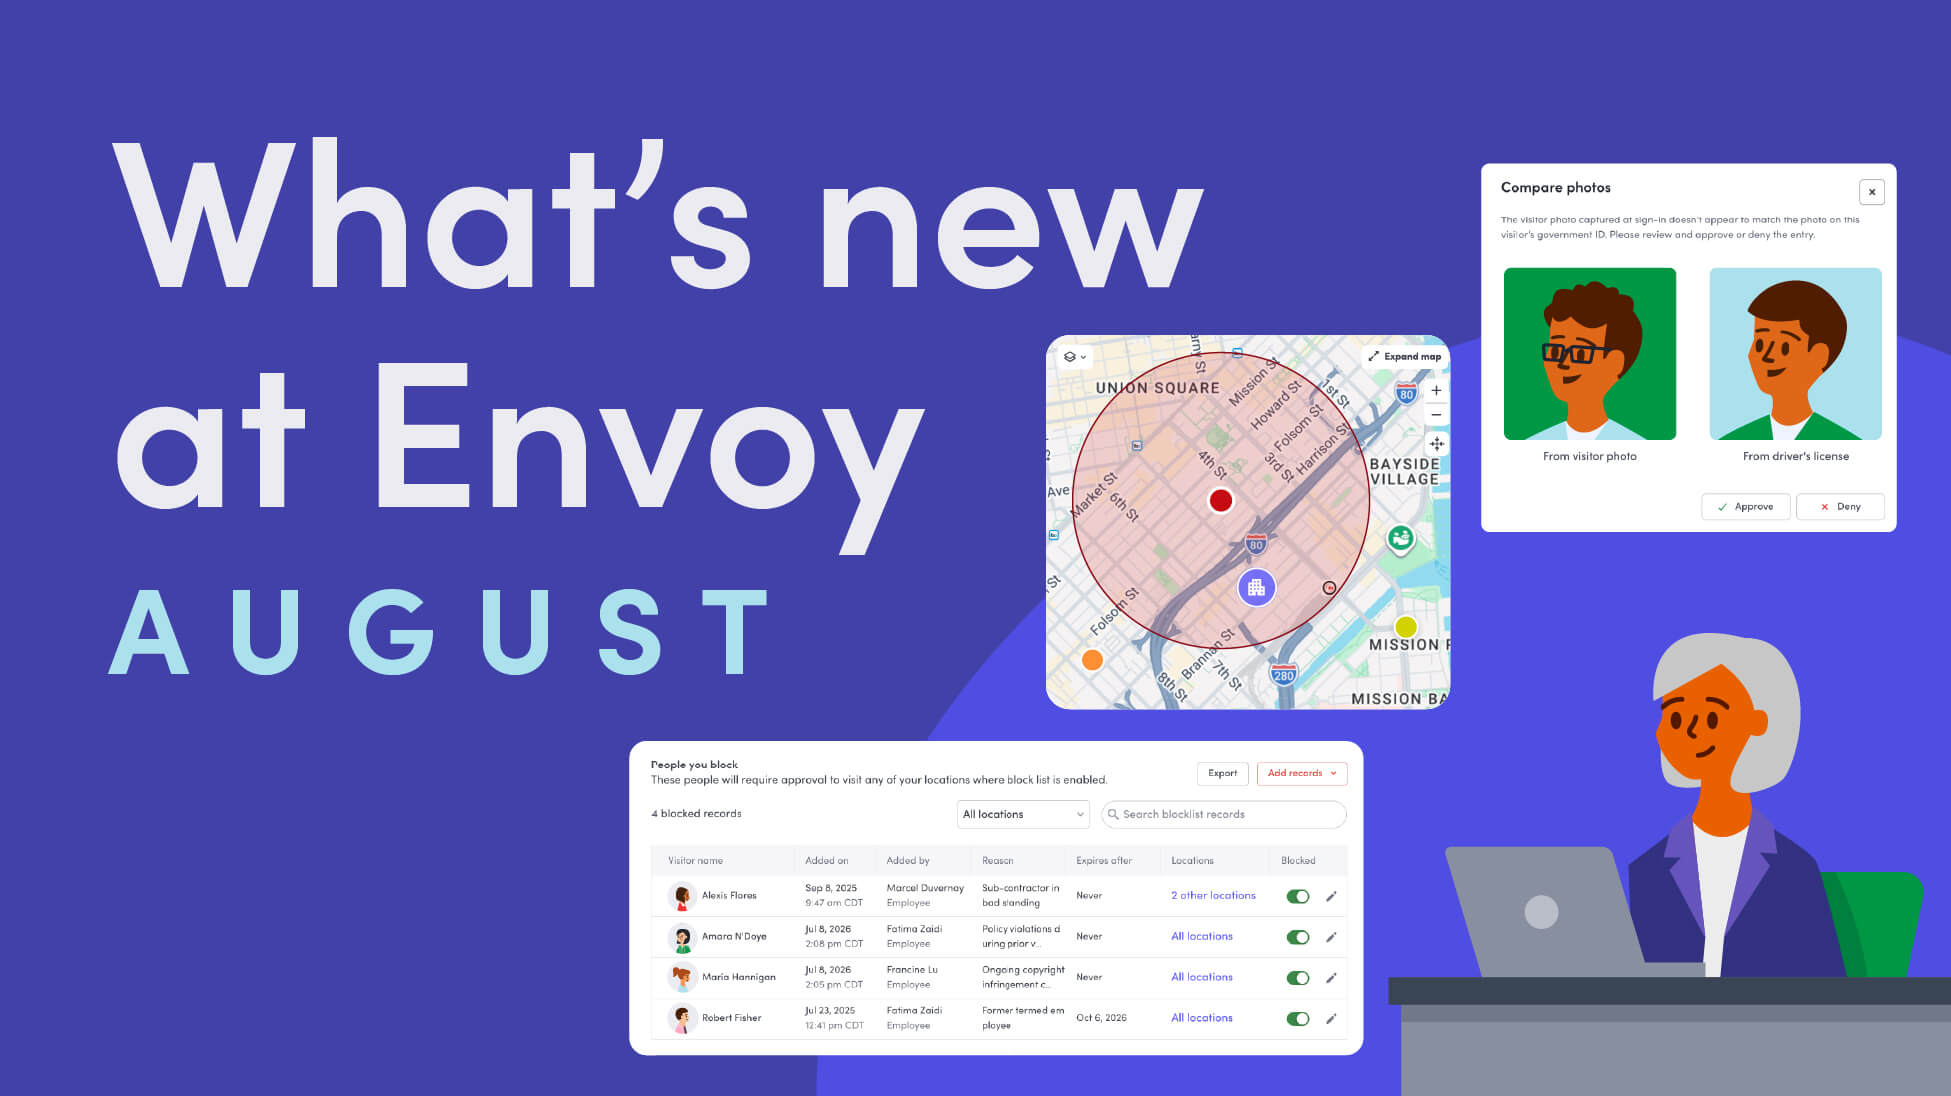
Envoy’s August 2026 releases introduce Envoy Response for emergency management, bringing emergency response into the same platform you already use for visitor and workplace management.

Envoy's July 2026 releases focus on workplace intelligence features like HRIS directory sync, workplace map file exports, and mailroom management improvements through the Developer API.

Envoy data across 300+ U.S. metros reveals the one morning the World Cup actually emptied the office, and it wasn't when you'd think.

Envoy Academy is back with a full refresh. Still free, still on-demand, and organized by role so admins get fluent in Envoy fast.