
Data shows the return to the workplace is a tale of three waves


The data in this blog post looks at workplace entries from 5/1/2020-8/2/2021.
In March of 2020, companies across the world closed their workplaces. People everywhere began to work from home for the foreseeable future. To understand trends in workplace traffic since the start of the pandemic, we analyzed millions of employee and visitor sign-ins from over 14,000 locations in all 50 states. The major takeaway? There’s been a dramatic return to the workplace, despite the latest concerns around the pandemic. (We’re looking at you, Delta variant.) Here are the key takeaways from our recent analysis:
- Overall, the number of people coming into workplaces has tripled since May 2020
- In fact, it has quadrupled in key metropolitan cities: San Francisco, Philadelphia, New York City, and Chicago
- Since the pandemic, workplace traffic has been a tale of three waves: The most recent wave shows that the growth in workplace traffic has begun to flatten. But we’re not seeing the declines in traffic that we saw in spring 2020
- Despite overall workplace traffic slowing down, there are a few industries that have continued to see growth this summer: Materials is up 18.5% and Telecommunications Services is up 10.7%
Let’s dive into the data and explore these findings in more detail.
Workplace traffic: A tale of three waves
Since the beginning of the pandemic, workplace traffic has seen its ups and downs. We see a noticeable correlation between COVID case activity and workplace traffic. As cases rise, workplace foot traffic declines. The data also suggests that workplaces are continuing to adopt hybrid work models, which is evidenced by how many desks employees are reserving (two per week on average). This indicates that many of the employees who work on-site only do so for part of the week.
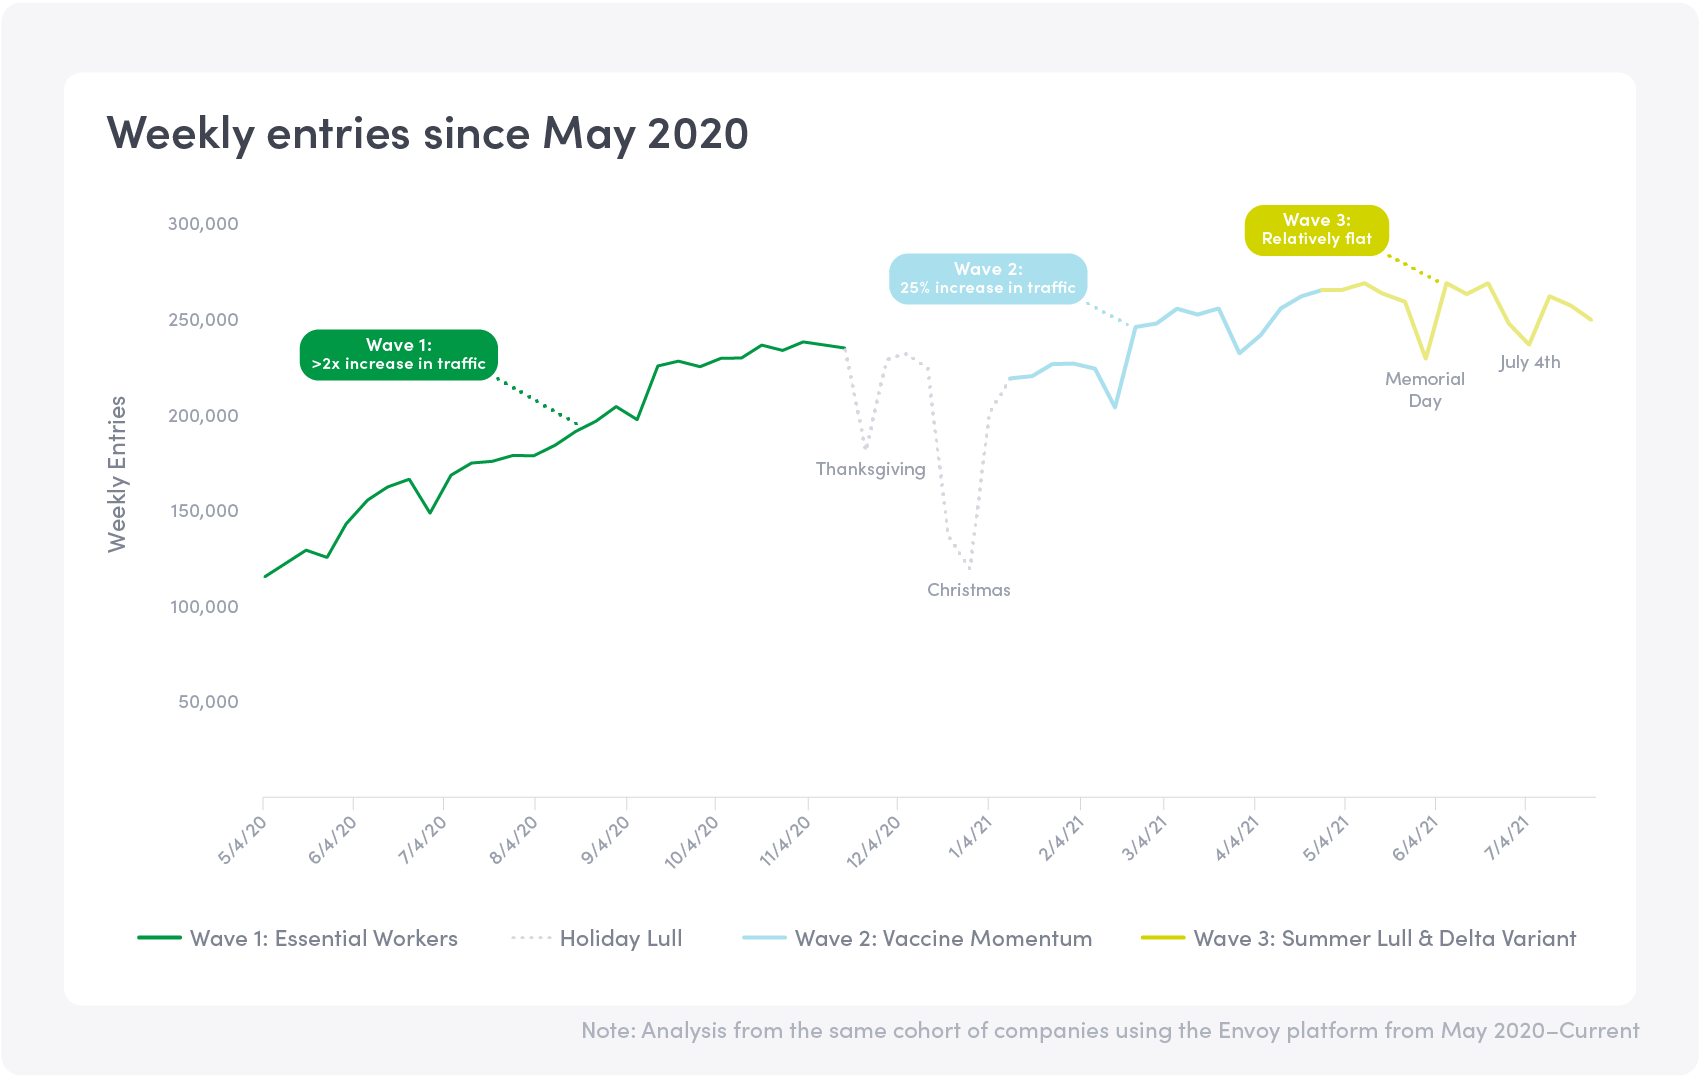
Wave 1: Essential workers
Immediately following COVID-related shutdowns, workplace traffic came to a dramatic halt. In the few months following traffic lows in early 2020, we saw strong increases in people returning to the workplace. We believe these workplace entries came from people in essential industries who worked to ensure the continuity of critical functions. From May through October 2020, we saw over a 2X increase in workplace traffic, indicating there was a significant decrease and recovery within that six-month period.
Wave 2: Momentum
After the typical November to December holiday lull, we entered the second phase of the return-to-the-workplace story. This phase was characterized by strong growth as many employees were vaccinated and came back to the workplace. By mid-March, the US reached a key milestone of administering 100 million vaccinations. We saw traffic growth—over a 25% increase in just three months—across companies of all sizes, industries, and geographies.
Wave 3: Summer lull and Delta variant
Finally, a summer lull coupled with increased concerns of a new highly-contagious Delta variant marks the third wave. During this phase, we’ve seen a slight decrease in growth (-4%) since the start of summer. Some of this could be due to the typical summer lull of employees taking more vacations. But we believe much is in reaction to the Delta variant. It’s worth noting that while the new variant is concerning, the data so far has painted a picture that’s much different than what we saw at the start of the pandemic.
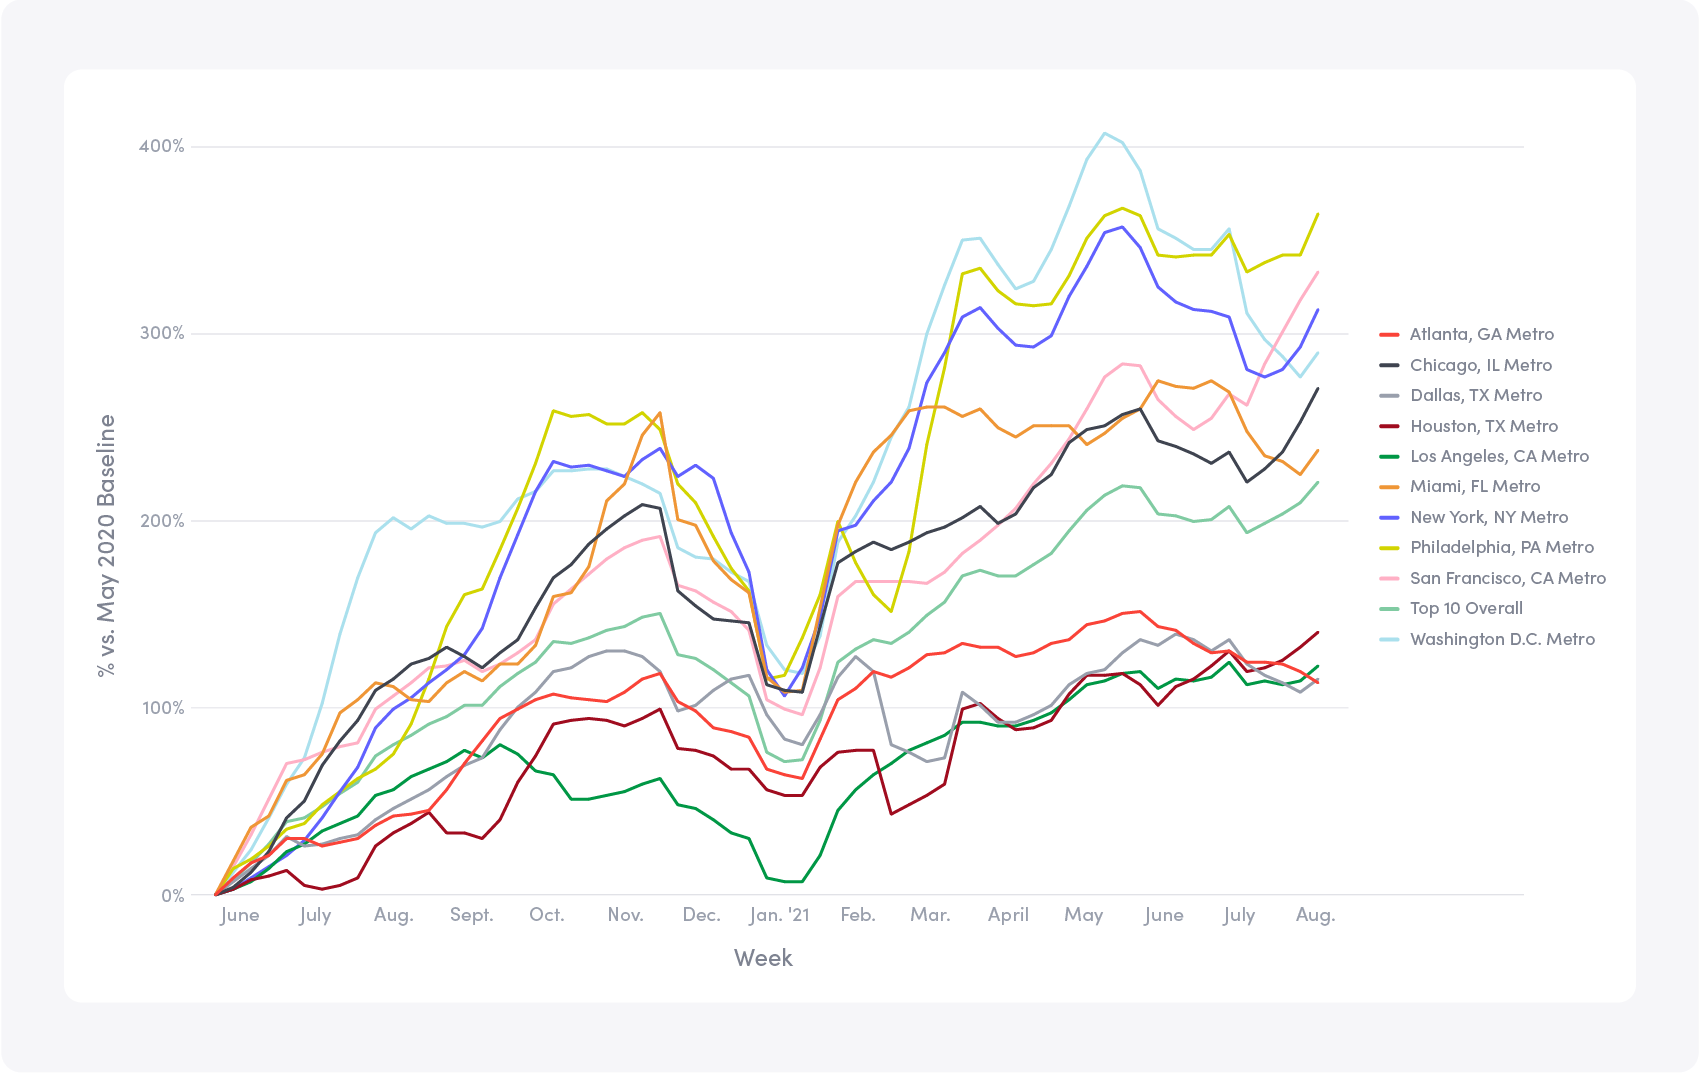
First, we’re not seeing 80% decreases in traffic like before. We’re seeing a slight decrease (-4% in weekly entries since the start of summer) as we collectively take more precautions to stay safe from this new variant. And while most of the major media coverage paints a “doom and gloom” picture like we saw last spring, we actually see quite a few areas of return-to-work resiliency. For example, traffic in the top 10 US metropolitan cities is up 10% since last month. We’re continuing to see strong growth in San Francisco, Philadelphia, New York City, and Chicago. The chart below shows how workplace foot traffic has changed in the top 10 US metropolitan areas compared to a May 2020 baseline. Percentages reflect a weekly average of workplace entries in each market compared to a May 2020 baseline.
Some industries also stand out for having a continued high growth rate since the start of summer (June 2021):
- Materials is up 18.5%
- Telecommunication Services is up 10.7%
- Utilities is up 7%
- Information Technology is up 4%

The data shows that workplace traffic has begun to slow recently. This indicates that people may feel more cautious about going on-site due to the Delta variant. As summer winds down, we anticipate a new wave of workplace foot traffic, contingent on COVID case numbers declining.
Final thoughts
While the pandemic has changed over time, the latest data reveals that employees have not stopped going into the workplace. Instead, we’ve seen a flattening of the growth curve this summer, which we believe is partly due to Delta variant concerns as well as people taking vacations and returning back to school. But unlike the start of the pandemic, today more people are vaccinated. We also believe employees are more informed about COVID risks. The data indicates that the return to the workplace has staying power: traffic hasn’t declined as dramatically as it did at the start of the pandemic. Employers should be ready to welcome their people back to the workplace.
Preparing for the return to the workplace? Download our ebook, Space management tips to help your people thrive in a hybrid workplace, to learn how to optimize your space to support employee productivity and happiness.
Read more

Workplace security is critical to the future of your business. Learn why it matters, what threats to watch for, and how to strengthen your workplace security plan.

Searching for a visitor management solution? Learn what to look out for and how to choose the best tech for your team.

Managing your space well doesn’t have to be difficult. But if you want to be successful, you need the right approach.

A well-run workplace can set your team up for success. Learn why workplace management matters and how to do it right.

With more folks sending personal packages to the workplace, having a sound mailroom management system in place is key.